


Most practices find out their revenue cycle has a problem only after cash flow dips. By then, denials have piled up, claims have aged past 90 days, and staff are scrambling to catch up. These are some of the biggest revenue cycle management challenges practices face, and almost all of them show warning signs long before they hit the bank account.
The cost of missing those signs adds up. A study published in JAMA found that billing and insurance-related work costs physician practices between 3% and 25% of professional revenue, depending on the type of visit. RCM KPIs give you a way to see where that money goes and where it is draining. This guide covers the healthcare revenue cycle KPIs that matter most, what healthy numbers look like, and how to use them to fix problems before they cost you.
What is Revenue Cycle Management (RCM)?
Revenue cycle management is the full financial journey of a patient visit, from scheduling and insurance verification to coding, claim submission, payment posting, denial follow-up, and patient billing. Every step affects how much you collect and how quickly. If you have ever wondered what RCM is in practical terms, think of it as the system that turns the care you provide into revenue you actually receive. Many practices strengthen this system with dedicated RCM services that manage each stage end to end.
Why RCM KPIs Matter for Medical Practices
You cannot improve what you do not measure. Revenue cycle KPIs turn a complex, multi-step process into a handful of numbers you can review every month. The American Academy of Family Physicians has long compared these figures to a practice’s vital signs, because they show at a glance whether the business side of care is healthy.
Tracking revenue cycle management KPIs also helps you set priorities. Instead of guessing why collections feel slow, you can see whether the issue is coding, payer delays, or patient balances. That clarity makes it easier to apply proven revenue cycle management best practices where they will have the biggest impact.
Top RCM KPIs Every Practice Should Track
There is no shortage of revenue cycle management metrics. The Healthcare Financial Management Association’s MAP Keys alone include 29 KPIs across five areas of the revenue cycle. For most medical practices, though, the following healthcare revenue cycle KPIs tell the most important story.
1. Days in Accounts Receivable (A/R)
Days in A/R measures how long, on average, it takes to get paid after a service is billed.
Formula: Total A/R ÷ Average daily charges
Benchmark: Under 40 days, with 30 to 40 days considered healthy for most practices.
A rising number usually points to slow follow-up, payer delays, or claims stuck in rework.
2. A/R Over 90 Days
This shows the share of your outstanding receivables that is more than 90 days old. The older a claim gets, the less likely you are to collect it.
Formula: (A/R over 90 days ÷ Total A/R) × 100
Benchmark: 10% or less.
3. Clean Claim Rate
Your clean claim rate is the percentage of claims accepted by payers on the first submission, with no edits or corrections. It reflects the accuracy of your front desk, coding, and charge entry. Strong medical billing solutions with built-in claim scrubbing can push this number up quickly.
Formula: (Claims accepted without edits ÷ Total claims submitted) × 100
Benchmark: 95% or higher.
4. Claim Denial Rate
The denial rate tracks how many claims payers reject or deny. Denials are a growing problem across the industry. Research in JAMA Internal Medicine estimates that 18% of insured U.S. adults reported a health insurance denial in 2023.
Formula: (Denied claims ÷ Total claims submitted) × 100
Benchmark: Under 5%, with anything above 8% to 10% calling for immediate attention.
5. First-Pass Resolution Rate
This measures how many claims are paid in full on the first submission, without appeals or resubmission. When this rate drops, a structured denial management service can help you find root causes and recover revenue faster.
Formula: (Claims paid on first submission ÷ Total claims submitted) × 100
Benchmark: 90% or higher.
6. Net Collection Rate
Net collection rate shows how much of the money you are contractually owed you actually collect. It is one of the clearest indicators of overall revenue cycle health.
Formula: [Payments ÷ (Charges − Contractual adjustments)] × 100
Benchmark: 95% or higher.
7. Cost to Collect
Cost to collect tells you how much you spend to bring in each dollar of revenue, including staff, software, and outsourcing costs. Most cost to collect revenue cycle benchmarks fall between 2% and 5% of net patient revenue, so a figure above that range is worth investigating.
Formula: (Total revenue cycle costs ÷ Total payments collected) × 100
Benchmark: 2% to 5%.
8. Charge Lag
Charge lag is the time between the date of service and the date the charge is entered or billed. Every extra day delays payment.
Formula: Billing date − Date of service (averaged across claims)
Benchmark: Within 24 to 72 hours.
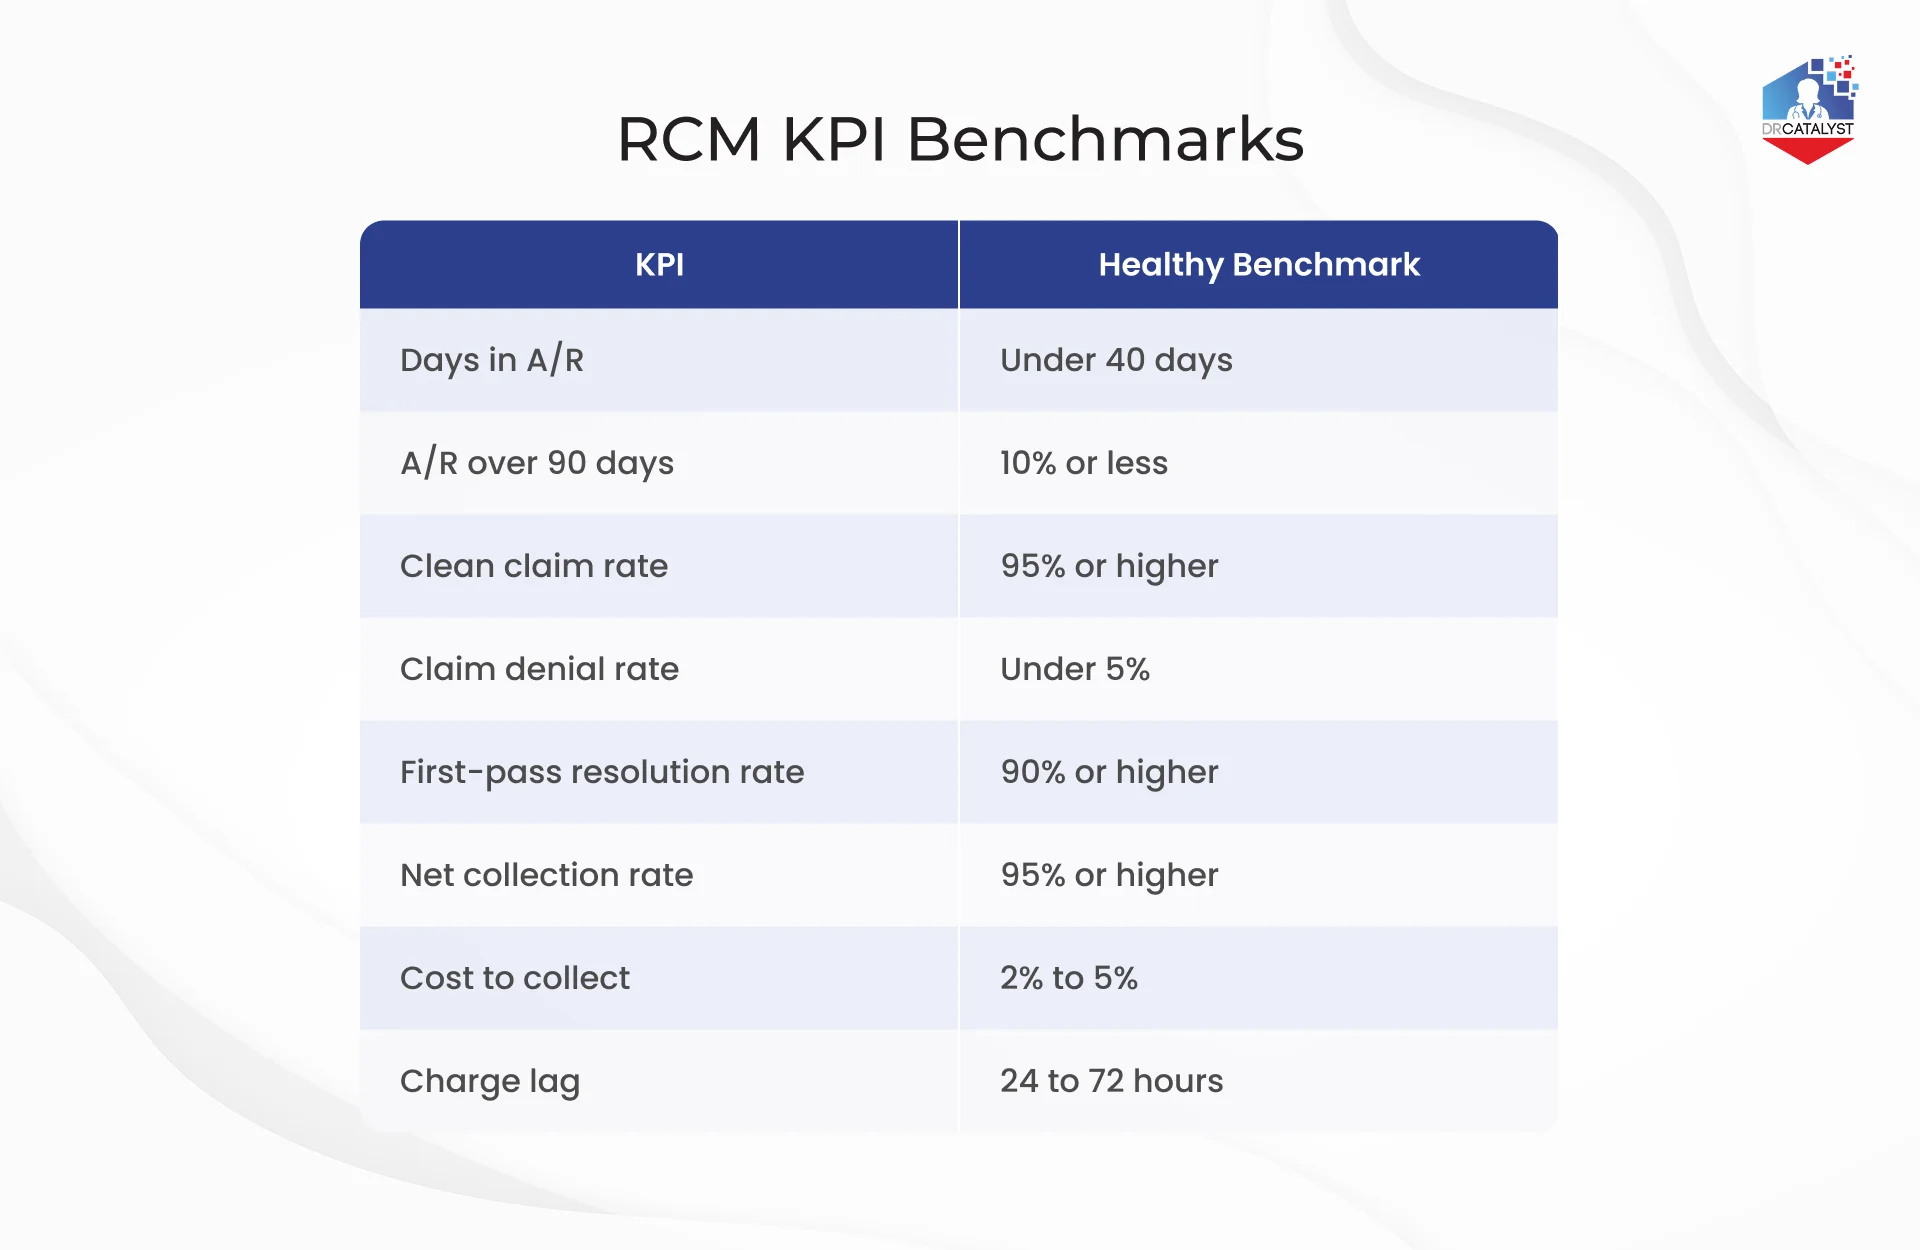
Benchmarks vary by specialty, payer mix, and practice size, so use these as a starting point rather than a strict target.
How RCM KPIs Help Identify Revenue Cycle Bottlenecks
Individual numbers are useful. Patterns are even more useful. When you review RCM KPIs together, they point to the exact stage where revenue slows down.
A low clean claim rate paired with a high denial rate usually signals front-end problems, such as missed benefits checks, registration errors, or coding mistakes. Coding issues often spike when code sets change, and CMS releases new ICD-10 codes every October 1. Rising days in A/R with a normal clean claim rate, on the other hand, point to slow follow-up or payer delays. A high cost to collect often means staff is spending too much time on manual rework.
These patterns become harder to spot as a practice grows. Each location may register patients, code, and follow up differently, which is why multi-location RCM solutions rely on standardized reporting so leaders can compare performance side by side.
How Technology and Automation Improve RCM KPI Performance
Many of the manual steps that drag down revenue cycle KPIs can now be automated. According to the CAQH Index, the healthcare industry could save upwards of $20 billion by moving administrative transactions, such as eligibility checks and claim status inquiries, to fully electronic processes.
Automation helps on several fronts. Real-time eligibility verification reduces front-end denials. Claim scrubbers catch errors before submission, lifting your clean claim rate. Dashboards track KPIs automatically, so you are not building spreadsheets at the end of every month. These tools are among the most important RCM trends shaping how practices manage revenue today.
Payment posting is another area where technology pays off. Electronic funds transfer and electronic remittance advice, both supported by CMS operating rules, speed up payments and make it easier to match deposits to claims. That shortens days in A/R and reduces posting errors.
Technology works best, though, when experienced people interpret the data and act on it. A dashboard can show a rising denial rate, but someone still has to find the cause, fix the workflow, and follow through on appeals.
How DrCatalyst Helps Practices Improve Their RCM KPIs
That is where DrCatalyst comes in. Since 2010, DrCatalyst has helped practices across the country improve their healthcare revenue cycle KPIs with specialty-trained billing and RCM teams. As part of the Meditab group of companies, we work directly inside 85+ EHR and practice management systems, so there is no disruption to your workflow.
Our teams complete charge entry and payment posting within 24 to 48 hours and work denials within 48 to 72 hours. Every account includes multiple levels of supervision, a separate quality assurance team, a dedicated account manager, and regular KPI reports, so you always know where your numbers stand. Our RCM clients see an average 18% increase in revenue. If you are weighing the benefits of outsourcing RCM, we can show you exactly how your current KPIs compare and where the biggest gains are.
In a Nutshell
Healthy revenue does not happen by accident. It comes from watching the right numbers and acting on them early. Days in A/R, clean claim rate, denial rate, net collection rate, and cost to collect each show a different side of your financial health, and together they reveal exactly where revenue slows down.
Start by tracking a few core revenue cycle management KPIs every month, compare them against industry benchmarks, and focus on the gaps that cost you the most. Over time, small improvements in these numbers add up to faster payments, fewer write-offs, and a more predictable cash flow for your practice.
FAQs
RCM, or revenue cycle management, is the process practices use to manage the financial side of patient care, from scheduling and insurance verification to coding, billing, payment collection, and denial management.
The most important RCM KPIs for medical practices are days in A/R, A/R over 90 days, clean claim rate, denial rate, first-pass resolution rate, net collection rate, cost to collect, and charge lag.
Most cost to collect revenue cycle benchmarks fall between 2% and 5% of net patient revenue. A higher figure often signals manual processes or excessive rework.
Review core revenue cycle KPIs at least monthly. High-volume metrics such as denials and charge lag are worth checking weekly so problems are caught early.
The terms are often used interchangeably. Revenue cycle management metrics can include any data point you track, while KPIs are the select few metrics most closely tied to your financial goals.